Sunday, 29 November 2015

The median PE Ratio by Market Capitalization for 4888 US-listed stocks.


As many of you know here at Quantr.co we provide daily stock market data directly to your speadsheet for thousands of stocks listed in the United States, and every now and then we like to use this data to give our readers a little snapshot of the market.

Today we're looking at price to earning ratios and how they vary throughout the market as a whole depending on the size of the company. For this study we analyzed 4888 stocks and found the median value for each specific market capitalisation range.

The result for median PE ratios by Market Capitalisation as of market close on Friday November 27 2015 is as follows:


Median PE Ratio (ttm) courtesy of Quantr.co


Next the result for median Forward PE ratios by Market Capitalisation in the US is below:

Median Forward PE Ratios courtesy of Quantr.co


As for the market as a whole. After analyzing all 4888 stocks we came up with a:


Median US market price to earnings ratio of 19.78 
and a 
Median US market forward PE of 16.08

Wednesday, 25 November 2015

Results - Investment strategies investigated - Part i - Relative Strength Index

As many of you will know we started an experiment last month on the use of the Relative Strength Index to buy undervalued stocks.

The theory goes that an RSI approaching 30 (or below) is oversold, and the stock may now start an uptrend, and an RSI approaching 70 (or above) is overbought, potentially causing the asset to start a downtrend.

As of October 25 2014 there were 703 stocks that are approaching an RSI of 30. For the purpose of this experiment we are going to class 'approaching an RSI of 30' as any stock below an RSI of 40 on 14 day basis.

For this investigation we looked at the what if scenario for portfolio performance if buying all stocks approaching an RSI of 30, all stocks below an RSI of 30, as well as a specially selected group of stocks approaching an RSI of 30 that satisfy a few fundamental factors. We also sneaked in a fourth group of 20 stocks that were selected at complete random to test the validity of the results more so.

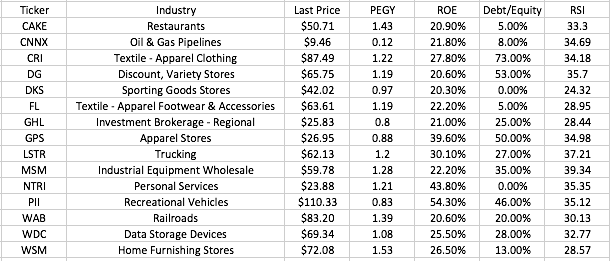
The special group of stocks, shown in the image below, were picked as they satisfied certain criterion necessary to be included in this particular portfolio.

  • Return on Equity > 20% 
  • Debt to Equity < 80% 
  • PEGY Ratio < 2 
  • Relative Strength Index < 40


Well, the results are in and they are somewhat interesting. For the record, we plan to repeat this experiment a few times to account for different market conditions and to test reliability, as we all know by now that past results do not guarantee future results.

The results:


So, as you can see disappointingly the random selection ended up the victor, outperforming all selections and the market during these 20 trading days. But that's not the whole story. There seems be a case here for a reduction in the holding period for each of the groups of stocks. 9 days turned out to be the optimal holding period during this experiment.


RSI Special RSI < 30 RSI < 40 Random Market
Day 9 6.07% 1.95% 3.86% 3.22% 1.19%

As you can see above, as of Day 9 every single group of stocks outperformed the market, and by a reasonable margin. The decline that follows shortly after could show that potential RSI gains are ephemeral in nature and do not necessarily end up in overbought territory (RSI >70) before they decline once again. We should note that we were especially pleased with performance of the specially selected group of stocks at Day 9. Picking a group of downbeat, but reasonably sound, stocks rather than a blanket selection of all stocks approaching an RSI of 30 seems logical and appears valid.

We'll let you know how things go the next time we test this strategy. Feel free to try the strategy yourself and let us know how you get on.

- J


Saturday, 21 November 2015

Central Bank Interest Rates as of Nov 21 2015


Central Bank Rate Country Rate Previous Change Date
 Australian RBA Australia 2.000 % 2.250 % 5/05/2015
 Banco Central Chile 3.000 % 3.250 % 10-16-2014
 Bank of Korea South Korea 1.500 % 1.750 % 6/11/2015
 Brazilian BACEN Brazil 14.250 % 13.750 % 07-30-2015
 British BoE Great Britain 0.500 % 1.000 % 3/05/2009
 Canadian BOC Canada 0.500 % 0.750 % 07-15-2015
 Chinese PBC China 4.350 % 4.600 % 10-23-2015
 Czech CNB Czech Republic 0.050 % 0.250 % 11/01/2012
 Danish Nationalbanken Denmark 0.050 % 0.200 % 01-19-2015
 European ECB Europe 0.050 % 0.150 % 9/04/2014
 Hungarian National Bank Hungary 1.350 % 1.500 % 07-21-2015
 Indian RBI India 6.750 % 7.250 % 09-29-2015
 Indonesian BI Indonesia 7.500 % 7.750 % 02-17-2015
 Israeli BOI Israel 0.100 % 0.250 % 02-23-2015
 Japanese BoJ Japan 0.100 % 0.100 % 10/05/2010
 Mexican Banxico Mexico 3.000 % 3.500 % 6/06/2014
 New Zealand Reserve Bank New Zealand 2.750 % 3.000 % 9/10/2015
 Norwegian Sentralbanken Norway 0.750 % 1.000 % 09-24-2015
 Polish Narodowy Poland 1.500 % 2.000 % 3/04/2015
 Russian CBR Russia 11.000 % 11.500 % 07-31-2015
 Saudi Arabian SAMA Saudi Arabia 2.000 % 2.500 % 01-19-2009
 South African SARB South Africa 6.250 % 6.000 % 11-19-2015
 Swedish Riksbank Sweden -0.350 % -0.250 % 7/02/2015
 Swiss SNB Switzerland -0.750 % -0.500 % 01-15-2015
 Turkish CBRT Turkey 7.500 % 7.750 % 02-24-2015
United States FED United States 0.250 % 1.000 % 12-16-2008

Sunday, 25 October 2015

Investment strategies investigated - Part i - Relative Strength Index

As some of you will be aware, Quantr.co provide investors and traders with all the tools needed to download stock market data directly into Excel spreadsheets. As we cover over 7000 US listed stocks it's a fantastic place to investigate investment strategies.

The first of our strategies is the use of the relative strength index (RSI) in buying undervalued stocks. As Investopedia explain "The RSI is a technical momentum indicator that compares the magnitude of recent gains to recent losses in an attempt to determine overbought and oversold conditions of an asset. It is calculated using the following formula:

RSI = 100 - 100/(1 + RS*)

*Where RS = Average of x days' up closes / Average of x days' down closes.

Most people deem an RSI approaching 30 (or below) to be oversold, meaning that the stock may now start an uptrend, and an RSI approaching 70 (or above) to be overbought, causing the asset to start a downtrend.

Our approach


So, for this investigation we are going to look at the what if scenario for the portfolio performance if buying all stocks approaching an RSI of 30, as well as a specially selected group of stocks approaching an RSI of 30 that satisfy a few fundamental factors.

As of October 25 2014 we have 703 stocks that are approaching an RSI of 30. For the purpose of this experiment we are going to class 'approaching an RSI of 30' as any stock below an RSI of 40 on 14 day basis.

We have placed all 703 stocks in an equally-weighted portfolio together and will track them for one month, removing individual stocks from the study as they approach an RSI of 70 and thus are categorised as being overbought.  At the end of the month we will judge the portfolio against the market performance and other portfolios within the study.

The special selection


Sometimes there are fundamental reasons why a stock is trading with a low RSI. A company that is heading to bankruptcy, for example, would see very little buying when heading to $0. 
So for this reason we have screened through our data for stocks with fundamentally strong features that may greater encourage a change in momentum.

The follow criterion had to be satisfied to be included in this particular portfolio.
  • Return on Equity > 20%
  • Debt to Equity  < 80%
  • PEGY Ratio < 2
  • Relative Strength Index < 40
Out of over 7000 stocks we were left with just 15 stocks that satisfied our criterion. These stocks were:


Once again these stocks will be held for one month, or until they approach an RSI of 70 and thus are categorised as being overbought.

Finally - for the purists.


Some people prefer to class oversold as strictly below an RSI of 30. For this reason, a third portfolio has been constructed containing 148 stocks that currently trade with an RSI below 30. The same rules apply for this portfolio.

We will report back with regular updates as we investigate this trading strategy. 

- J


Thursday, 22 October 2015

A Short Case For Under Armour, Inc. Ahead Of Q3 Earnings

A Short Case For Under Armour, Inc. Ahead Of Q3 Earnings
Previously posted on Seeking Alpha on Oct 22, 2015 
Is Under Armour overvalued relative to its growth prospects?
We love Under Armour. We think it is a fantastic company with some highly marketable athletes promoting high quality products at a time where there is evidence of an accelerated global adoption of the athleisure trend.
But, is the Company overvalued? We believe, that trading at a PE ttm of 107.78, the growth UA would need to produce over the next five years to produce good to great shareholder returns is not quite achievable.
Time To Fall In Line With Its Peers
Our thesis is built on the premise that we believe the time has come for UA to start to fall in line with its peers, most notably NKE, and in five years believe the market will expect the company to be trading at a Price to Earnings ratio of approximately 33.
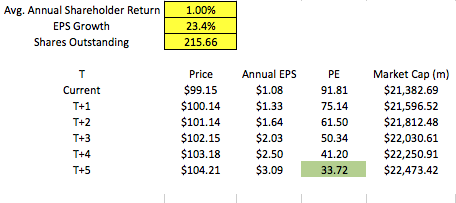
The current consensus is for UA to grow EPS at a rate of 23.4% per year for the next five years. Should this be the case, and that the PE Ratio drops to 33 as we predict, the outlook would be as follows:
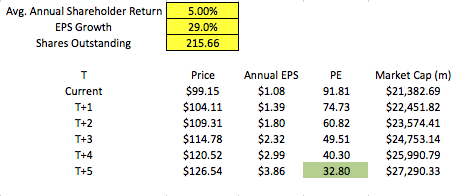
For us, under the terms of our thesis, in order for UA to be fairly priced, and achieve an average shareholder return of 5% per year over the next five years, we posit that the Company needs to be growing their EPS by approximately 29% per year. Only then would we look at going long with UA. Were they to achieve this then the outlook could look like this:
Unfortunately, we think this growth is out of reach for the Company. Sure, we see great opportunity in the Asia market, but we don't believe there is enough there to achieve 29% annual EPS growth. Additionally, with a sustainable growth rate (ROE x (1 - dividend-payout ratio)) of 15%, there would potentially be substantial financial strain on the company to grow at any rate higher than this, let alone almost twice the SGR.
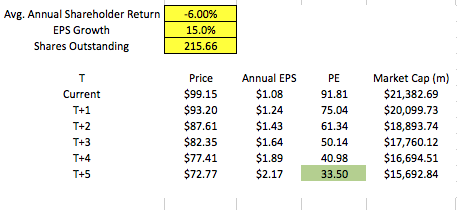
The worst case scenario, the Company only being able to achieve 15% annual EPS growth over the next five years (in line with the SGR), we would envisage the outlook to look a lot like this:
Thursday's Earnings
Before the market opens on Thursday UA will announce their third quarter earnings. The Wall Street consensus is for EPS of $0.44 and revenue of $1.173 BN. These earnings may just give us an indication as to whether 29% EPS growth is an achievable feat or merely a pipe dream.